Agenda:
What is Skewness?
Types of Skewness
Interpretation of Skewness
How Do We Transform Skewed Data?
What is Kurtosis?
Types of Kurtosis
Interpretation of Kurtosis
What is Skewness?
Skewness measures the asymmetry in the normal distribution graph.

A normal distribution graph has zero skewness. This means the graph is symmetric about the mean, left side is a mirror image of the right side of the graph.
It is measure of lack of symmetry in the normal distribution graph

Types of Skewness
There are 2 types of Skewness
Positive Skewness
Negative Skewness

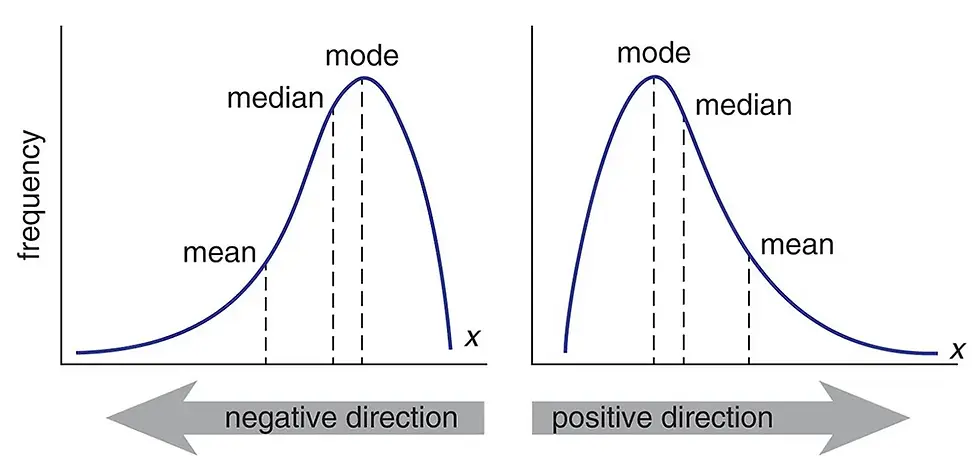
Positive Skew

The probability distribution with its tail on the right side of the mean is a positively skewed distribution a.k.a Right Skewed Distribution.
This means majority of the data distribution will be on the left side of the mean, while the lower ranging values will be on the right side of the curve.
The value of skewness for a positively skewed distribution is greater than zero.
This also tells me the direction of outliers, which is on the right side of the curve in the tail.

Negative Skewness

The probability distribution with its tail on the left side of the mean is a negatively skewed distribution a.k.a Left Skewed Distribution.
This means majority of the data distribution will be on the right side of the mean, while the lower ranging values will be on the left side of the curve.
The value of skewness for a negatively skewed distribution is less than zero.
This also tells me the direction of outliers, which is on the left side of the curve in the tail.

Interpretation of Skewness
Skewness tells about 2 things:
Direction of Outliers
Distribution of Mean, Median and Mode
Direction of Outliers
In a positive skew, the outliers will be present on the right side of the curve while in a negative skew, the outliers will be present on the left side of the curve. Distribution of Mean, Median and Mode
In a positive skew, Mean>Median>Mode
In a negative skew Mean<Median<Mode
Generally for the value of Skewness:
If the value is less than -0.5, we consider the distribution to be negatively skewed or left-skewed where data points cluster on the right side and the tails are longer on the left side of the distribution
Whereas if the value is greater than 0.5, we consider the distribution to be positively skewed or right-skewed where data points cluster on the left side and the tails are longer on the right side of the distribution
And finally, if the value is between -0.5 and 0.5, we consider the distribution to be approximately symmetric

How Do We Transform Skewed Data?
Since you know how much the skewed data can affect our machine learning model’s predicting capabilities, it is better to transform the skewed data to normally distributed data. Here are some of the ways you can transform your skewed data:
Power Transformation
Log Transformation
Exponential Transformation
What is Kurtosis?
Kurtosis measures whether your dataset is heavy-tailed or light-tailed compared to a normal distribution.

Data sets with high kurtosis have heavy tails and more outliers and data sets with low kurtosis tend to have light tails and fewer outliers.
Note that a histogram is an effective way to show both the skewness and kurtosis of a data set because you can easily spot if something is wrong with your data. A probability plot is also a great tool because a normal distribution would just follow the straight line.

Types of Kurtosis
There are 3 types of Kurtosis:
1. Mesokurtic — For the symmetric type of distribution, the Kurtosis value will be close to Three. We call such types of distributions as Mesokurtic distribution. Its tails are similar to Gaussian Distribution.

2. Platykurtic — If there is a low presence of extreme values compared to Normal Distribution, then lesser data points will lie along the tail. In such cases, the Kurtosis value will be less than Three. We call such types of distributions as Platykurtic Distribution. It will have a thinner tail and a shorter distribution in comparison to Normal distribution.

3. Leptokurtic — If there are extreme values present in the data, then it means that more data points will lie along with the tails. In such cases, the value of K will be greater than Three. Here, Tail will be fatter and will have longer distribution. We call such types of distributions as Leptokurtic Distribution.

Interpretation of Kurtosis
Kurtosis can be understood with the help of Standard Deviation. Smaller the Standard Deviation, Steeper the Distribution whereas Higher the Standard Deviation, Flatter the distribution.

Joke of the blog


Comentarios